15 inventory management KPIs your business should track

Table of contents
Talk to a fulfillment consultant today
Inventory management is critical to any growing ecommerce brand, and tracking and optimizing inventory management KPIs is a great way for brands to understand where they’re excelling and where they could use some improvement.
What Are Inventory Management KPIs?
Inventory management KPIs focus on maintaining optimal inventory levels so brands don’t run out of stock and miss out on sales or need to pay to store too much stock. The following inventory KPIs allow brands to dial in on areas for optimization that can improve overall inventory and order management practices.
Types of Inventory Management KPIs to Track
Inventory KPIs generally fall into three categories: sales inventory, receiving inventory, and operational inventory.
Sales Inventory KPIs
Sales inventory KPIs focus on inventory metrics related to sales and can help brands better compete in a competitive market and optimize the sales team’s performance.
1. Days/Weeks on Hand
This inventory KPI measures how quickly a brand sells through its average inventory on hand. Generally, the fewer days inventory sits in a warehouse, the better it is for a brand’s overall bottom line because they aren’t paying to store excess inventory. This inventory metric is calculated by dividing the average inventory for the year by the cost of goods sold and then multiplying by 365.When a brand accurately calculates inventory levels, it can restock products in time to avoid stockouts but also avoid having to pay extra storage for products that will just sit on shelves. Demand forecasting can help brands stay ahead of trends—such as seasonal customer demand for certain products—and allow them to plan ahead to have extra stock on hand.
2. Stock-to-Sales Ratio
The stock-to-sales ratio compares the average inventory value to the average sales value and is one measure of a company’s inventory level health. Most recommendations indicate brands keep this ratio around 4, which means they’ll have enough stock to avoid stockouts but not so much that they’re paying unnecessary storage costs.
3. Sell-Through Rate
The sell-through rate calculates the percentage of inventory sold within a time period compared to the amount of inventory received from a manufacturer in that same time period. A good goal for a sell-through rate is 80%, although this rate varies from industry to industry and brand to brand. Tracking the sell-through rate can help brands measure sales, create goals and optimize the supply chain.
4. Backorder Rate
A company’s backorder rate is the percentage of total orders that can’t be fulfilled due to out-of-stock products. This key inventory metric can track how well a company stocks high-demand products and responds to increases in demand for certain products. In an ideal world, this number would be 0, but brands can sell on backorder—as long as they’re clear with customers when they’ll receive their orders. Inventory tracking can help brands avoid stockouts by forecasting customer demand—which is especially important for products that have varying demand over a year—and by setting a clear replenishment point.
5. Inventory Turnover Rate
Inventory turnover is the ratio of the total cost of goods sold in a period (usually a year) to the cost of a company’s average inventory. Simply, it measures how efficiently a company uses its inventory. However, a low inventory turnover ratio could mean weak sales or excess inventory, while a high inventory turnover ratio could mean strong sales or inadequate inventory levels. Brands should aim for an inventory turnover rate of 2 to 4. Demand forecasting can also help brands determine the ideal turnover rate for their specific products.
6. Accuracy of Forecast Demand
This rate measures how accurate a brand’s demand forecasting was. Demand forecasting can be an invaluable tool for brands to stay ahead of demand trends and ensure they have enough stock on hand. However, it’s only valuable if it’s accurate. This inventory KPI can help brands improve their demand forecasting.Accuracy of forecast demand, also known as the demand forecast accuracy, is a percent of how close the actual on-hand quantity is to the forecast. It checks on what a company forecasted, ordered, and sold in the prior period.
Receiving Inventory KPIs
Receiving operational KPIs are specific to the process of inbound logistics, or the process of purchasing, receiving, and processing obsolete inventory.
7. Cost of Receiving Per Line
This metric measures the total cost of receiving a line of products from vendors—including handling and accounting for each item on the receiving end. The receiving process should get more efficient over time, and this cost should decrease. Keeping track of this key performance indicator can help brands determine if that’s happening or discover where the inefficiencies are.
8. Receiving Cycle Time
Similar to the cost of receiving per line, receiving cycle time also measures the efficiency of receiving items from a vendor. It tracks the time it takes to process received products, including accounting, sorting, and storing. This key performance indicator is calculated by dividing the time spent on sorting received stock by the total number of received items.
9. Put Away Time
This metric is simply how long it takes to put away merchandise when it arrives at a warehouse, on average. A faster put-away time reflects a more efficient warehouse. Brands can improve this metric by optimizing the position of merchandise in the warehouse, ie, closer to the loading bay for items that are replenished more often, and raising employee productivity.
10. Time to Receive
Time to receive is a metric that tracks the time from receiving products to when they are able to be sold, including time to put away, time for validation, and time to add to stock records. This is a more complete metric than putting away time, but they are both useful in looking for opportunities to optimize the receiving inventory process.
Operational Inventory KPIs
This last group of product inventory management KPIs measures how well a business is running, from customer satisfaction to on-time orders.
11. On-Time Orders
On-time orders measure the percentage of orders that are delivered on time and is a critical inventory management KPI.
12. Inventory Shrinkage
This metric measures the amount of inventory a brand should have (according to inventory tracking software) but cannot physically account for. What happens here is that a brand can sell a product that it does not actually have in the warehouse, which can lead to delayed orders and unsatisfied customers. Shrinkage can occur from misscounts, damage, fraud, or theft.
13. Inventory Carrying Cost
Inventory carrying cost represents the percentage of the total value that a brand pays to store inventory. This includes warehousing, insurance, rent, labor, and any unsellable products. These costs can vary depending on a brand’s storage and warehousing needs.
14. Customer Satisfaction Score
For customer analytics, this KPI measures how satisfied customers are with their purchases and purchasing experience. This is usually measured through survey responses that brands send out after purchases.
15. Service Level
This inventory management KPI measures the percentage of customers who do not experience stockouts and is calculated by dividing the total number of orders delivered by the number of orders received.
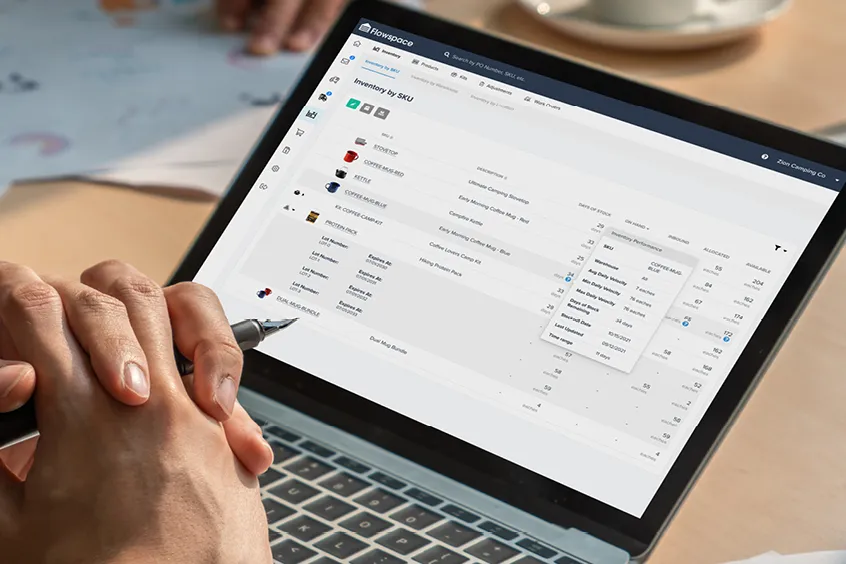
Optimize Operations with Flowspace
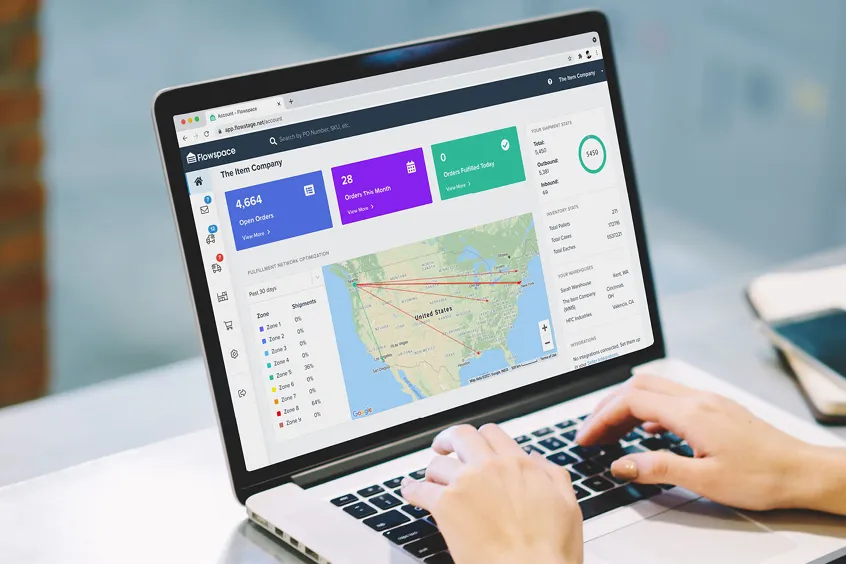
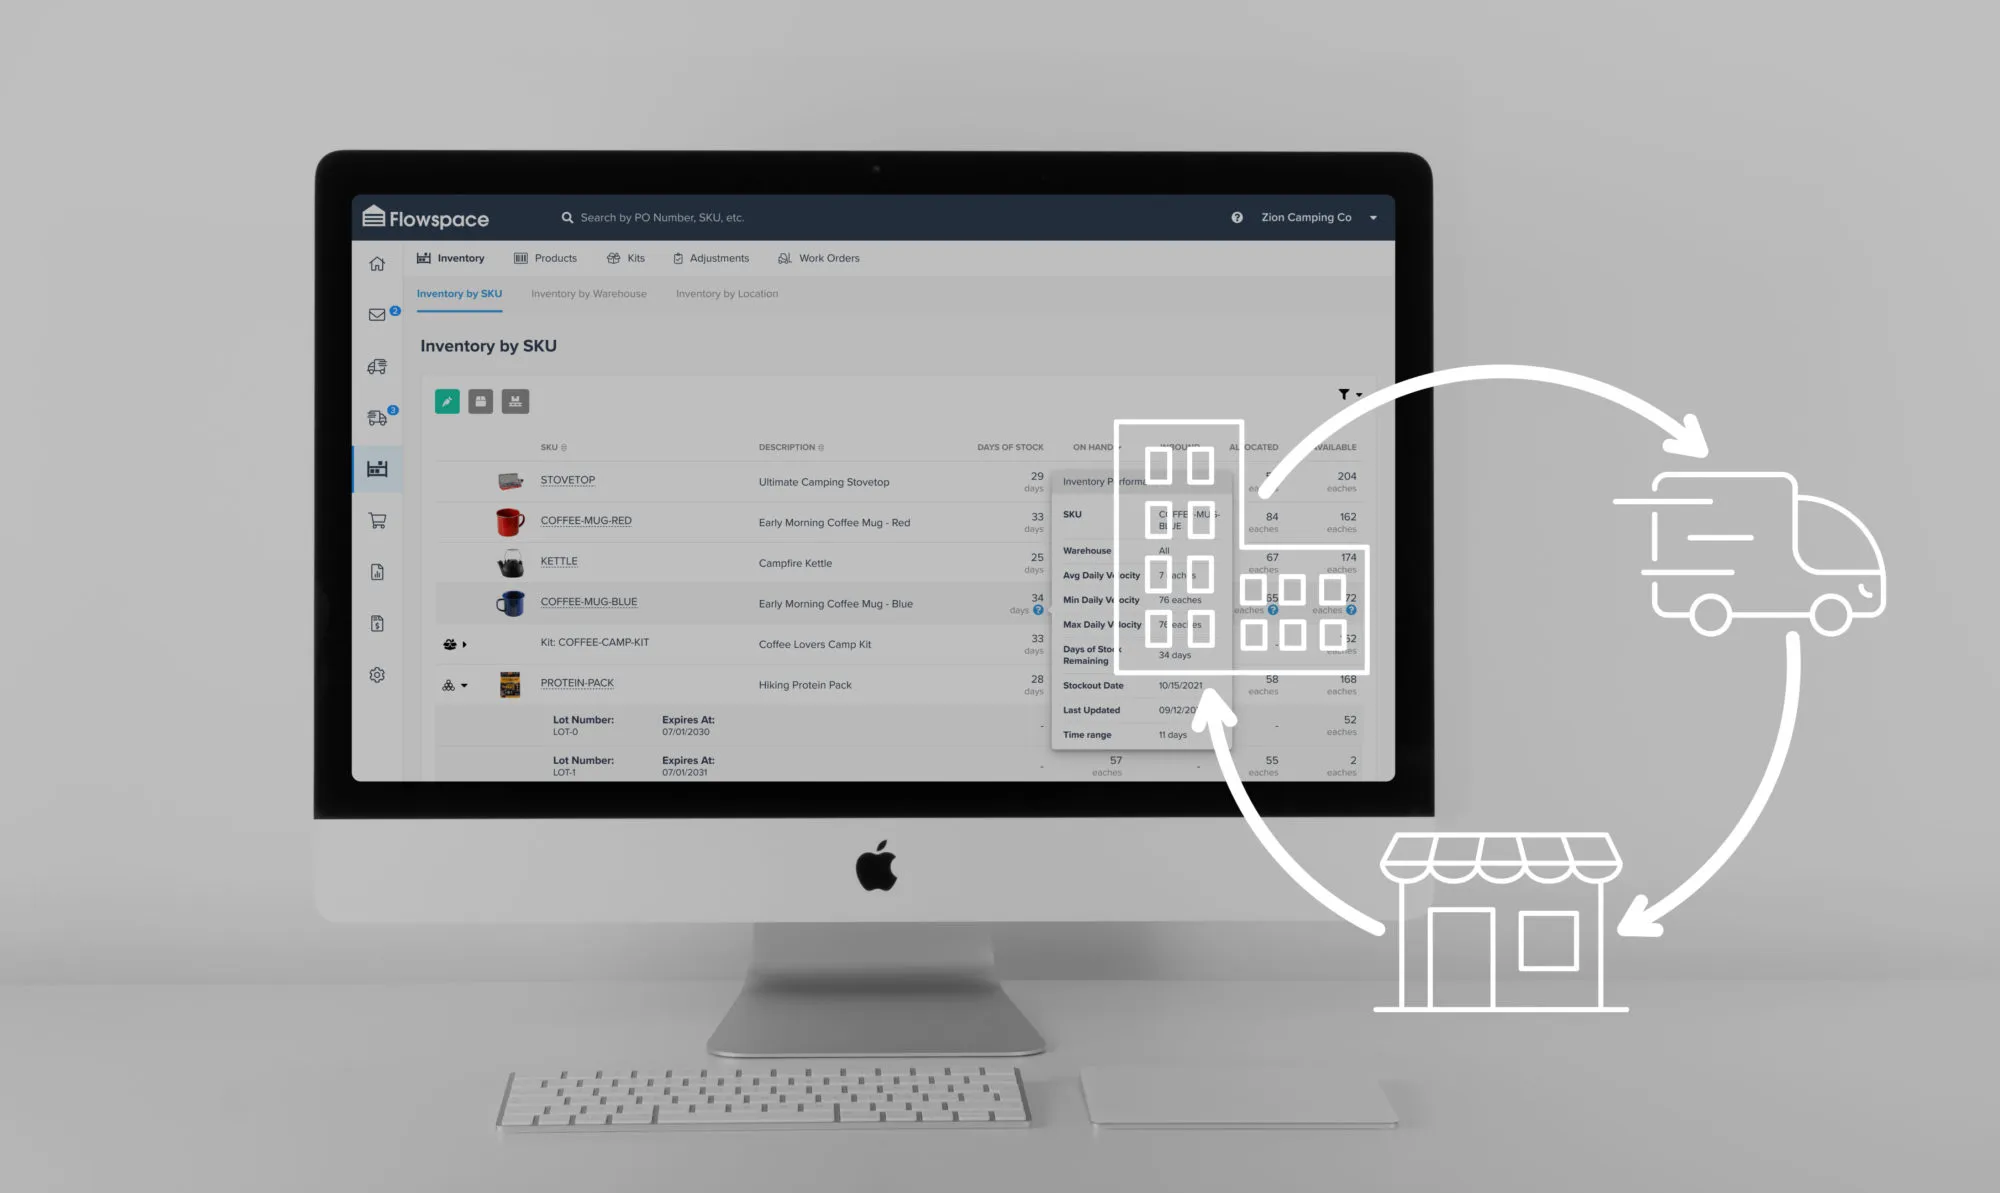
Flowspace partners with ecommerce brands to optimize logistics, including ordering, processing, picking, packing, loading, shipping, and more. Flowspace’s OmniFlow Visibility Suite gives brands real-time visibility and the ability to track inventory management KPIs. But Flowspace’s platform goes beyond just tracking operational KPIs; Flowspace’s platform gives retailers actionable insights in order to improve and optimize their inventory KPIs.The OmniFlow suite of tools provides visibility from order fulfillment through delivery with platform-level transparency so brands can stay ahead of low inventory. The platform’s real-time insights and predictive analytics allows brands to forecast inventory needs and never be caught with out-of-stock products. Ensuring optimal inventory levels can improve customer satisfaction and build customer retention. Flowspace’s inventory planning software gives brands real-time insights and recommendations for inventory optimization. Actionable inventory metrics can help brands make informed safety stock decisions to avoid an out-of-stock situation. Investing in inventory software makes warehouse management and inventory tracking much easier while ensuring customer service level expectations are met. Get in touch with Flowspace today to learn more about inventory management solutions.
Last Updated
category
Related articles


Start simplifying fulfillment with Flowspace today
Discover how Flowspace can simplify fulfillment and help your brand scale faster, with no long-term contracts or hidden commitments.
