Platform

Network Optimization
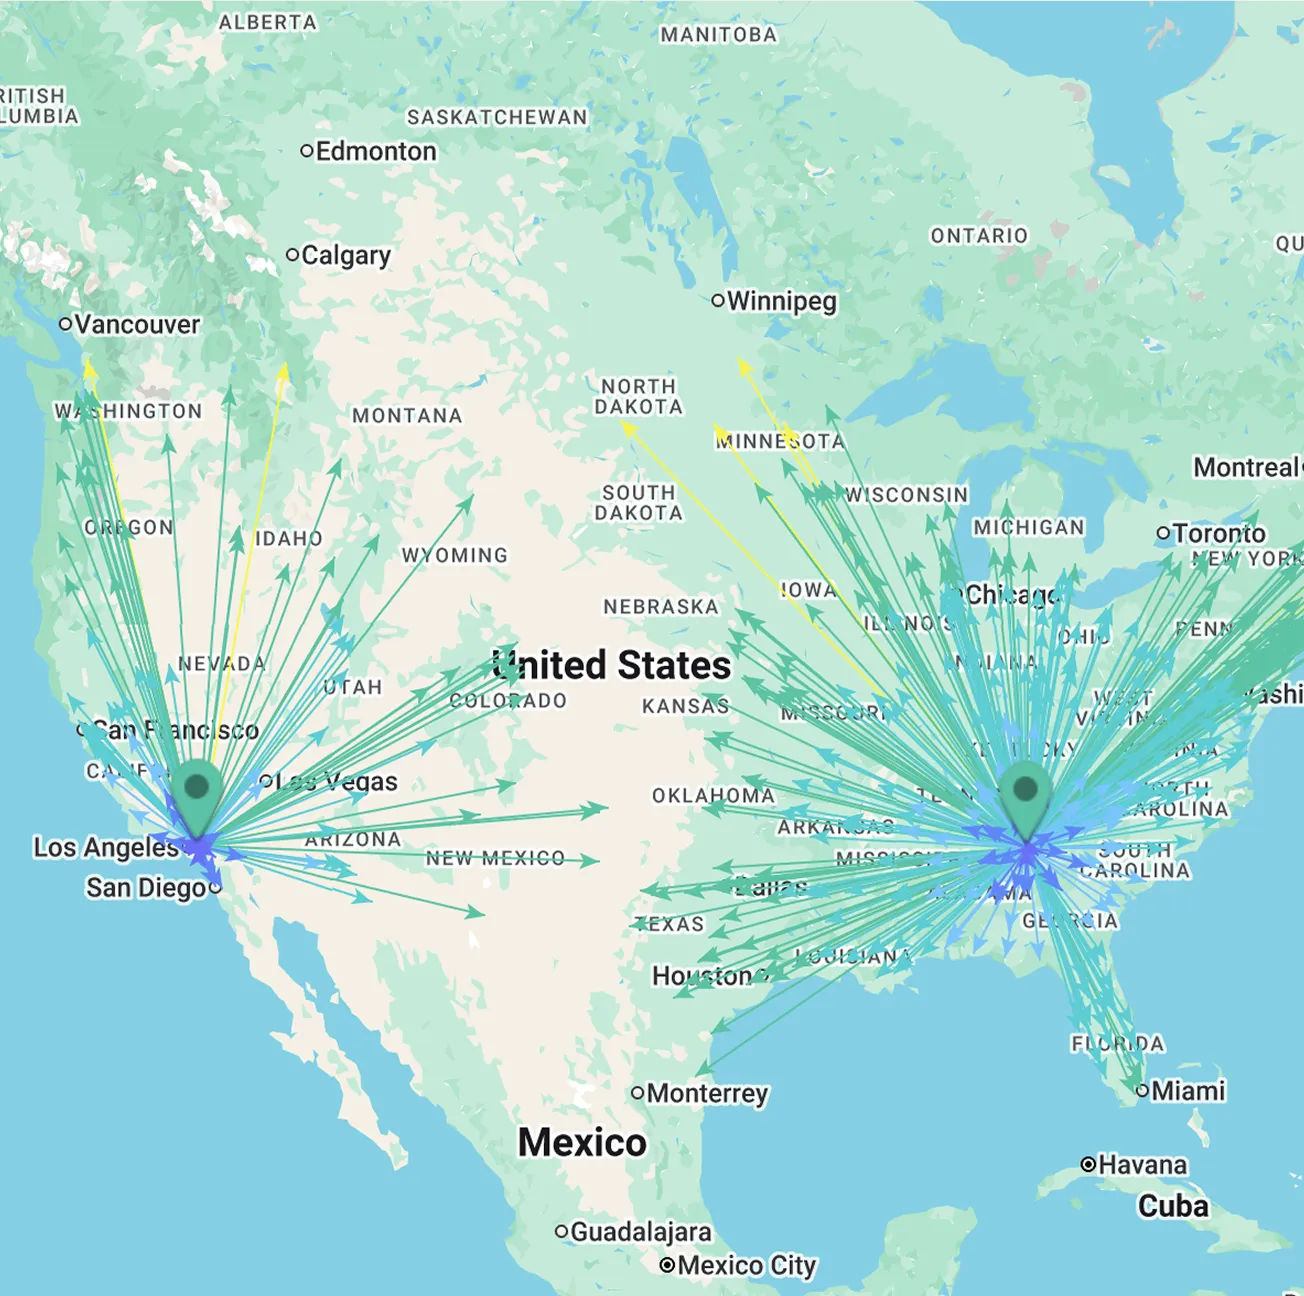
Let data find your next warehouse location
Your sales data knows the best places to put your products. We help you uncover them with a Free Network Optimization Study (NOS) that identifies the right warehouse locations for two-day delivery and lower costs based on your shipment history.
You’re in good company.


Optimize your logistics
Learn how Flowspace helps save you time and money with a free study.
Cost Savings
Get answers to your logistics questions instantly
Our Network Optimization Study is free and only takes seconds to run.
Gain strategic advantage with your warehouse location
Before
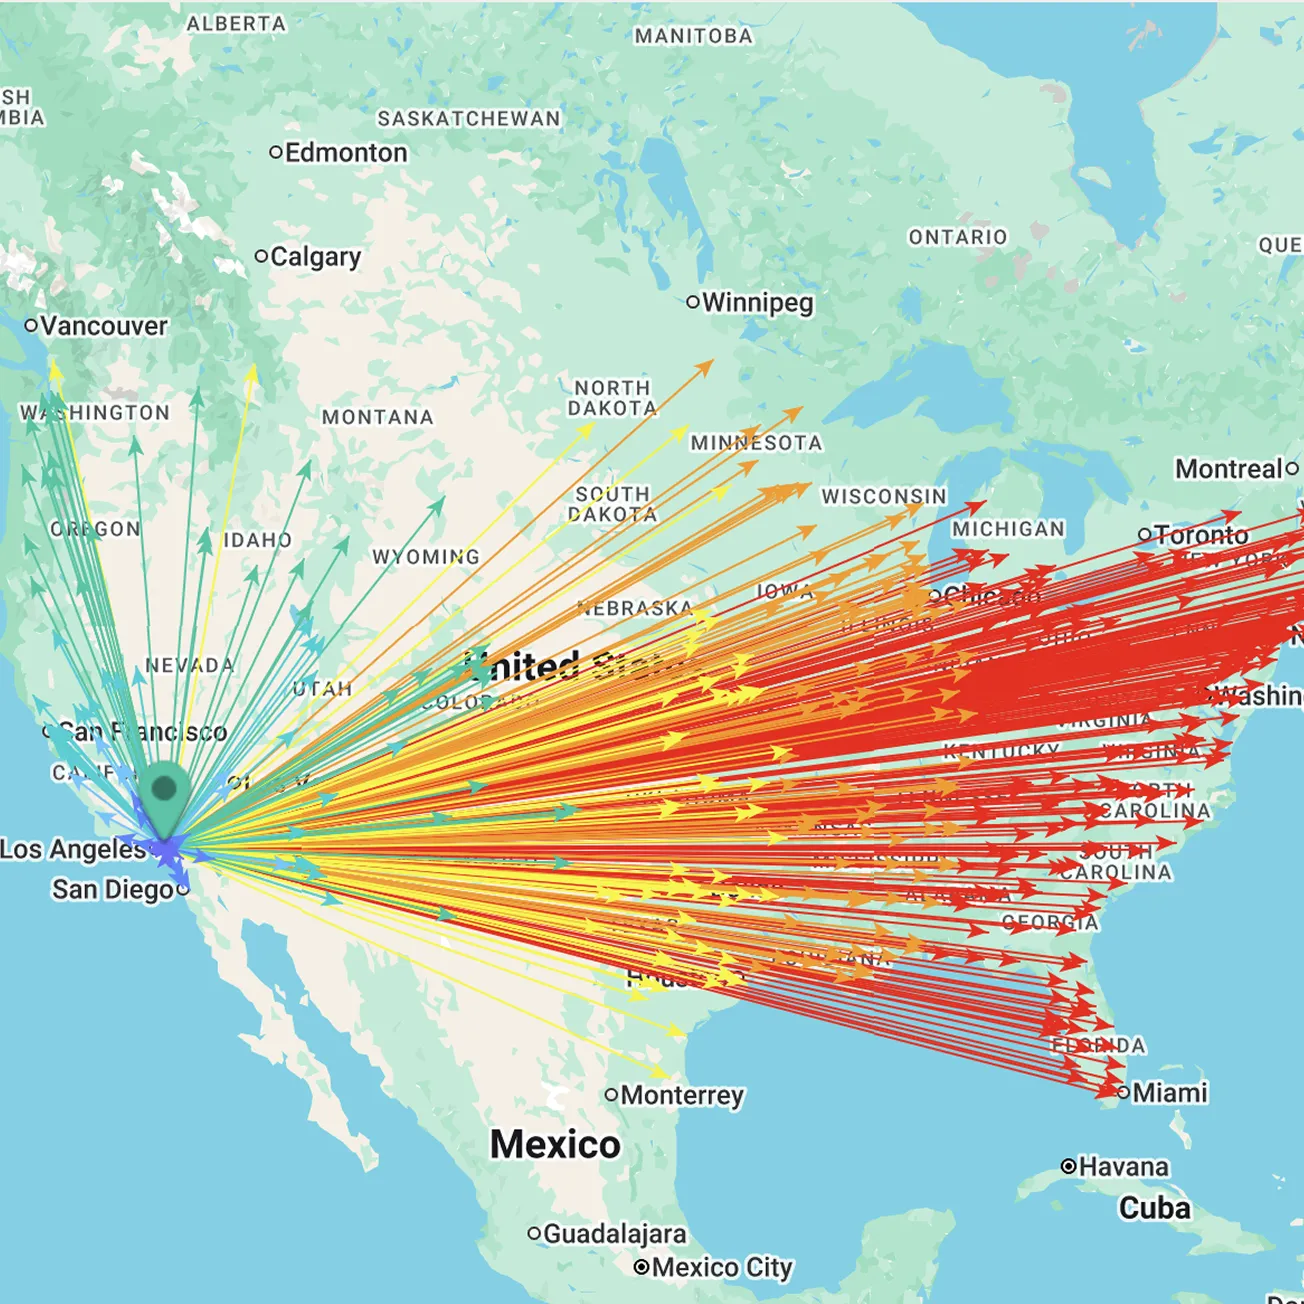
A top CPG dog food brand was shipping from the wrong location, driving up costs and delivery times.
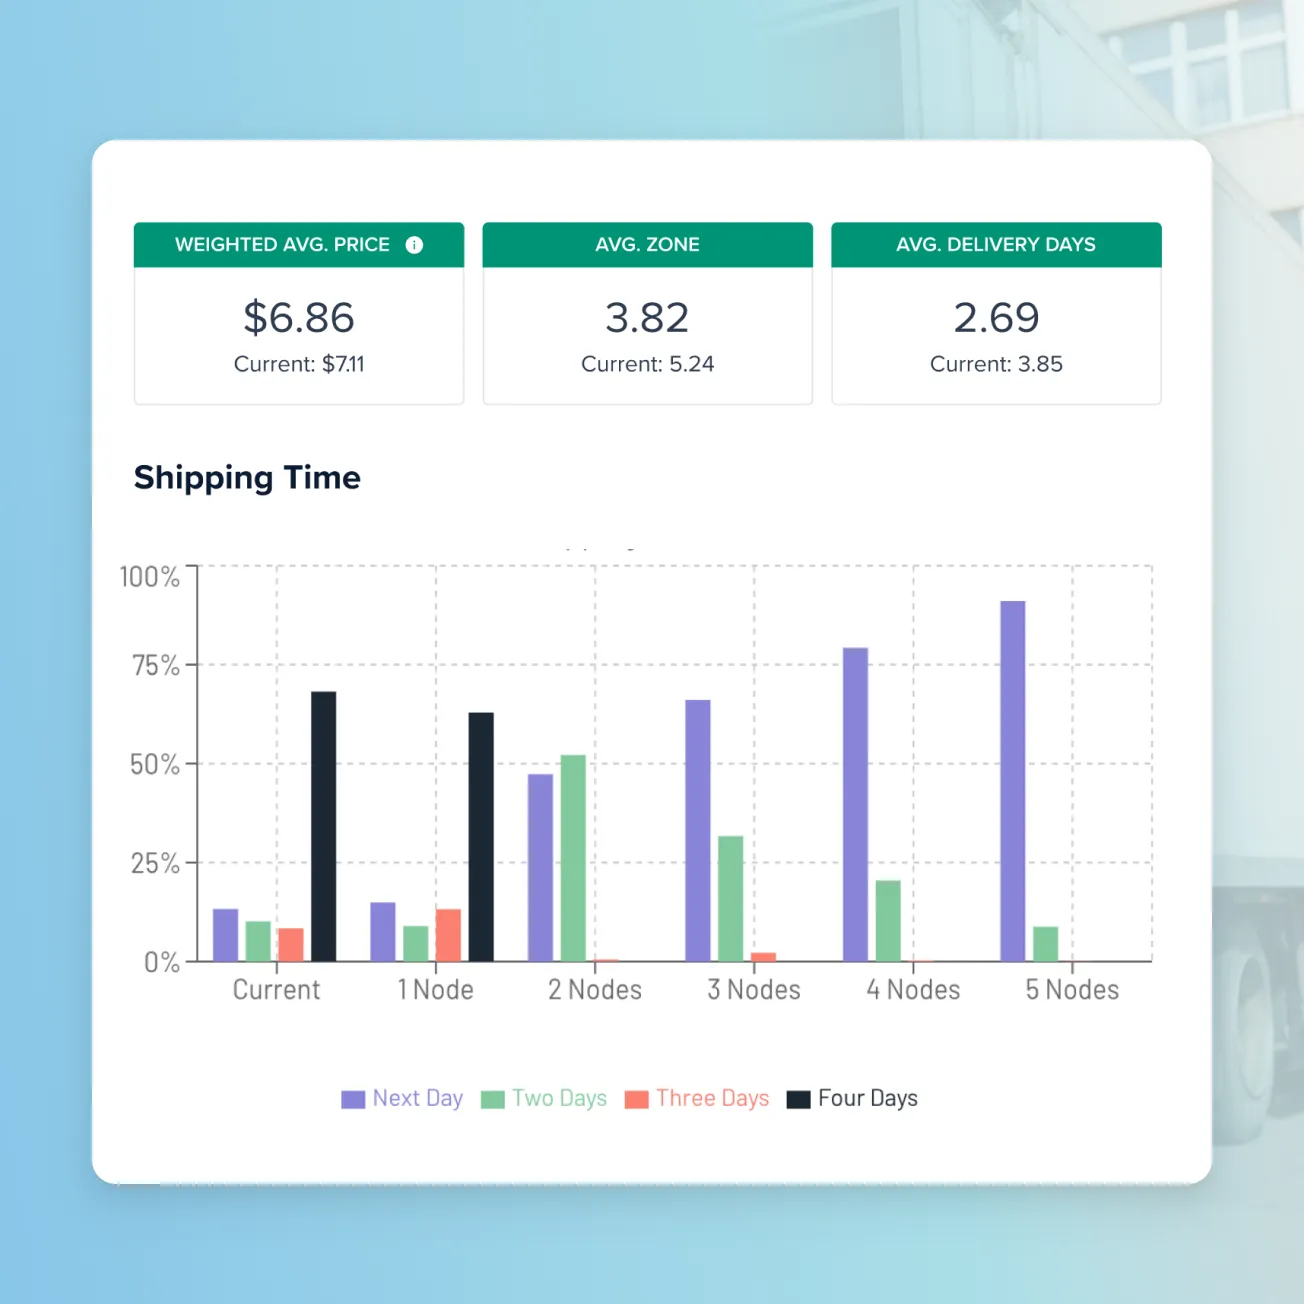
Average Zone: 6.1 Average Transit Days: 2.9
After
With Flowspace's network optimization, the CPG dog brand slashed shipping costs and delivery times in half by positioning products in the right locations.
Average Zone: 3.2 Average Transit Days: 1.3
(76% of shipments delivered within 2 days)
Want to see the platform in action?
Experience the platform firsthand with a 30-minute tour, covering every feature from order management to network optimization.

Frequently asked questions
Get quick answers to our top questions, from shipping and warehouse setup to scaling your brand.
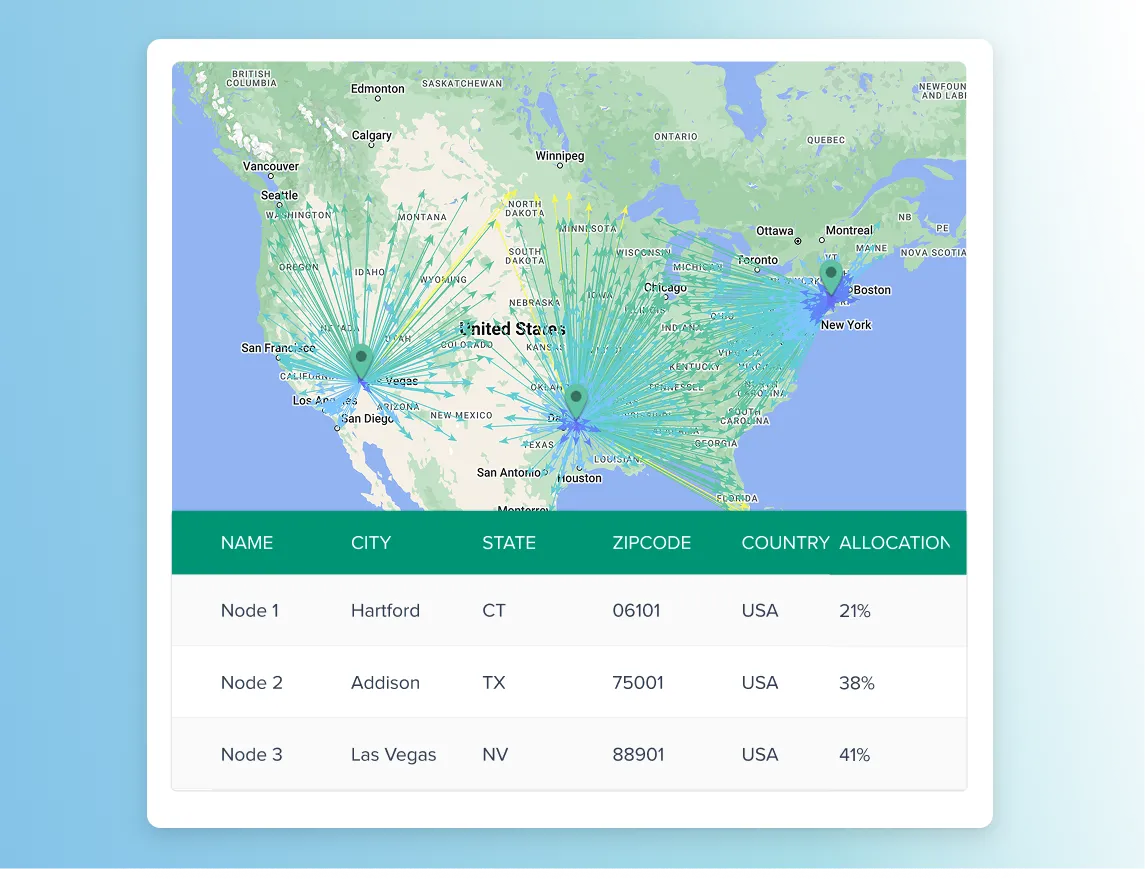
Flowspace evaluates factors such as historical sales data, delivery speed targets, shipping costs, and inventory distribution needs to recommend the right number of fulfillment locations for your business. We provide this analysis at no cost, helping you balance faster delivery with operational efficiency across nationwide warehouse coverage.
Flowspace routes orders based on real-time inventory availability, customer destination, and predefined shipping rules. This ensures each order ships from the location that best balances speed, cost, and service performance.
Flowspace improves delivery speed and cost by strategically positioning inventory closer to your customers based on demand patterns, shipping zones, and growth plans. By placing products in the right locations upfront, you can reduce transit times and control transportation costs over the long term.
Brands shipping nationally, managing multiple fulfillment locations, or scaling across ecommerce and retail channels benefit most from Flowspace’s network optimization. Through our free fulfillment analysis, we help you determine how to position inventory to improve delivery performance while keeping logistics costs under control.